Biodiversity data on microplankton in the Belgian part of the North Sea
- Partners: Flanders Marine Institute (VLIZ)
- Period: since May 2017
- Geographical coverage: Belgian Exclusive Economic Zone
- Taxonomic coverage: Microplankton, being a substantial part of phytoplankton. Find the complete list in this sheet
- Moratorium: None
- Data quality: Calibrated/Validated
How to interpret this dataset
Available columns
- Tripaction: Unique identifier to recognize actions taken aboard the RV Simon Stevin.
- Time: Time in UTC, beginning of sample timeperiod.
- Station: Name or code of sampling station or receiver code.
- Longitude: Center longitude in decimal degrees, WGS84.
- Latitude: Center latitude in decimal degrees, WGS84.
- Fluid Volume Imaged (ml): Total volume of subsample processed with the FlowCAM in mililitres.
- Sample Volume (ml): Total volume of the water sample in mililitres.
- Volume Filtered (l): Total volume of water filtered through the Apstein net in mililitres.
- Sample Dilution Factor: Dilution factor of the processed sample to obtain Particles Per Used Image (PPUI). Values between 1.10 to 1.20.
- Taxon: Taxonomic group of organisms or group of artefacts.
- Count: The exact number of specimens counted.
- Total Count: The exact number of specimens counted in the sample.
- Density (cell/l): Number of specimens per litre1.
- ActionType: The type of sampling equipment.
- Project: Project in charge of receiver deployments.
Abstract
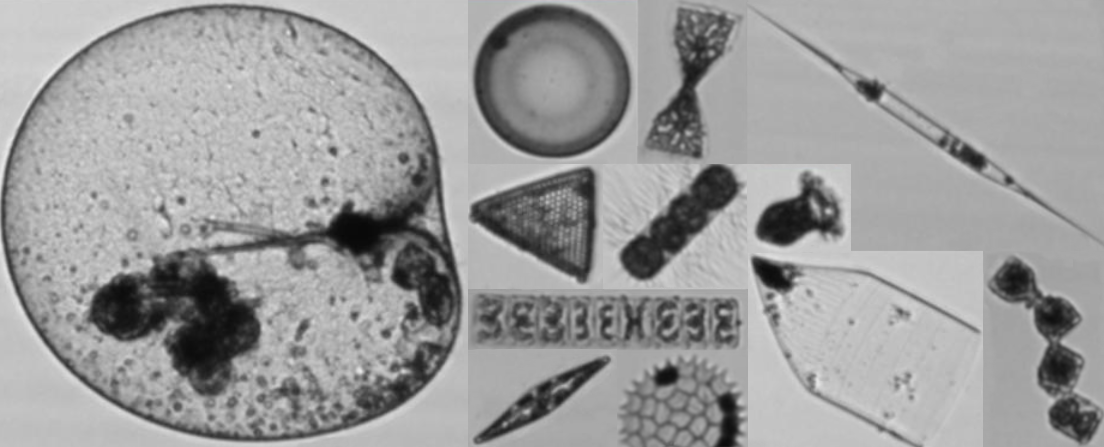
In the framework of the Lifewatch marine observatory a number of fixed stations in the Belgian Part of the North Sea (BPNS) are visited on a monthly or seasonal basis using RV Simon Stevin. A grid of nine stations covers the coastal zone and are sampled monthly. Eight additional stations, located further at sea, are sampled on a seasonal basis. Samples are taken using a 55µm mesh size Apstein net and fixed in Lugol’s iodine solution. In the lab, the samples are processed using a VS-4 FlowCAM model at 4X magnification, size range imaged is 55-300µm. The identification of the image data is done with the use of a classifier and followed by a manual validation step. Since May 2017, this dataset provides micro- and phytoplankton observations, mainly covering diatoms, dinoflagellates and cilliates, for the Belgian Part of the North Sea (BPNS).Taxonomic disclaimer: The blooms of Rhizosolenia and Bellerochea were flagged due to their extreme nature, which can lead to biased density estimates during these bloom periods. These taxa, when blooming outside their typical seasons, can skew results, although abundances remain unaffected. Additionally, the sampling methods, such as net sampling and prefilters, inherently under-sample taxa near the 300µm threshold, further contributing to the need for flagging these extreme events. It especially relates to samples 2021 07 120 (Rhizosolenia, Long (chained) diatom) and 2022 08 130 (Bellerochea en Rhizosolenia)
Further information can be found in this link or in a Data Paper: LifeWatch observatory data: phytoplankton observations in the Belgian Part of the North Sea.
At the moment, corrections are being made to the FlowCAM dataset and pipeline. Most up-to-date information on sampling or processing protocols and taxonomic information of the classes used during validations can be found in the following links:
How to cite these data
Lagaisse, R., Mortelmans J., Muyle, J., Amadei Martínez, L., Deneudt, K. (2024): LifeWatch observatory data: phytoplankton observations by FlowCam imaging in the Belgian Part of the North Sea. https://doi.org/10.14284/774. Accessed through the LifeWatch Data Explorer / lwdataexplorer R package.
Availability: This dataset is licensed under a Creative Commons Attribution 4.0 International License.
Please acknowledge as: This work makes use of the LifeWatch observation data and infrastructure (provided by VLIZ) funded by Research Foundation - Flanders (FWO) as part of the Belgian contribution to LifeWatch.
These data are also available in the R language with the lwdataxplorer package.
1 The formula linked in the datapaper that describes these data is not used anymore. The corrected formula used during the aggregations is:
Density = ConcentrationSample x SampleVolume(L) / VolumeFiltered(L)
Density = Count x SampleVolume(L) / FluidVolumeImaged(L) x VolumeFiltered(L) x SampleDilutionFactor